
Assalamualaikum and good evening.
Untuk post kali nie saya nak study satu kaunter yang naik agak banyaklah pada hari nie dan apa faktor2 penting yang membolehkan kita detect kaunter2 sebegini
So for today, saya nak study tentang MASTER, kenaikan 21.3% dalam satu hari dan apa faktor2 yang berlaku sebelum kenaikan nie
1) fundamental analysis
-macam selalu saya sebut, good fundamental tidak wajib bagi kriteria pemilihan saya. tapi kalau ada good fundamental insyallah boleh jadi supporting factor untuk kenaikan sesuatu kaunter
-a company fundamental can be considered as good if menepati 2 kriteria nie :
i. net profits increasing for atleast 2 consecutive quarters
ii. EPS increasing for atleast 2 consecutive quarters
-and MASTER menepati kedua2 kriteria tersebut, which is good

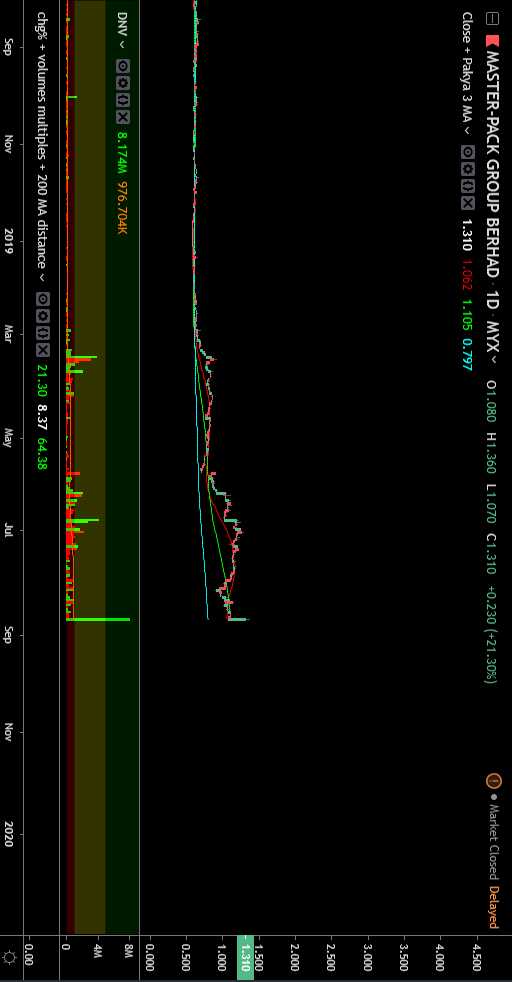
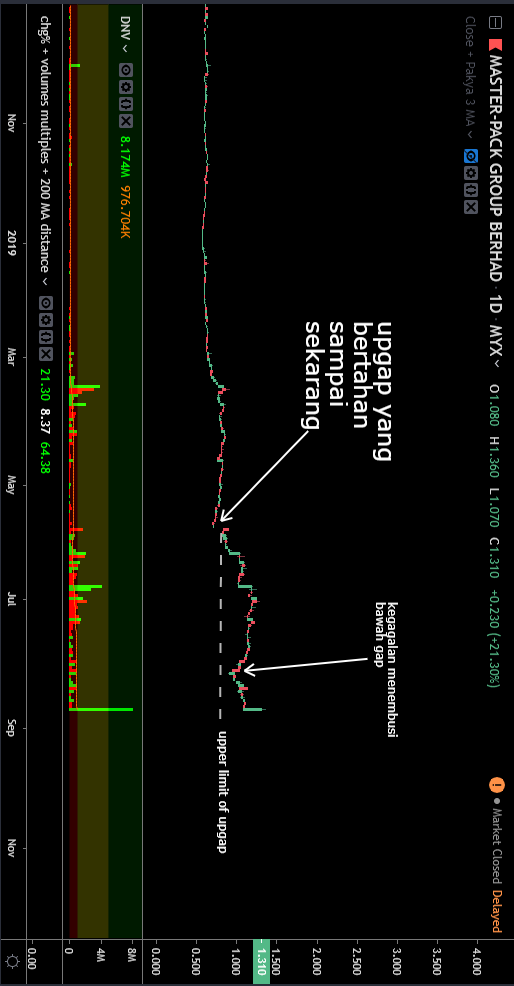
2) previous upgap
-notis pada 27/5/19 ada berlaku satu strong upgap
-sehingga sekarang upgap tu masih bertahan
-presence of an upgap that able to maintains its gap is a strong bullish factor. remember this.
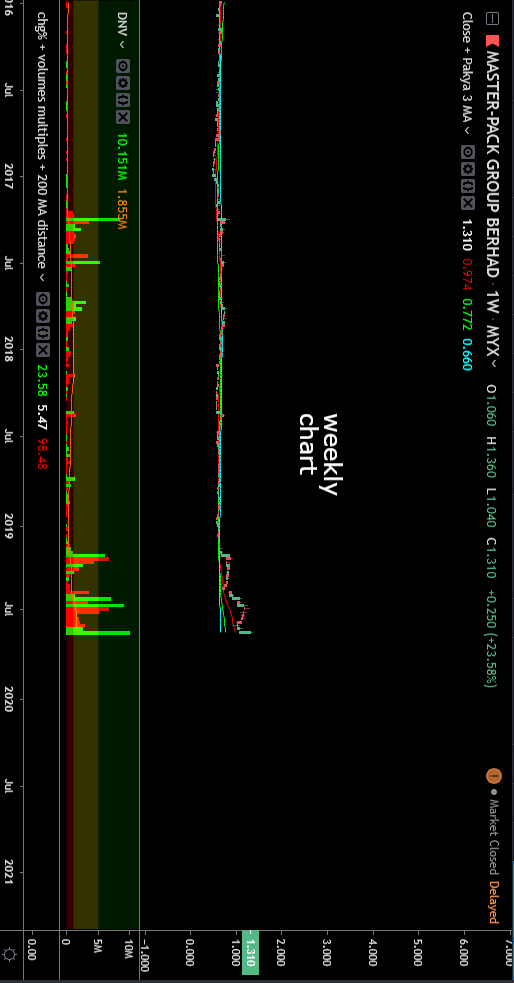
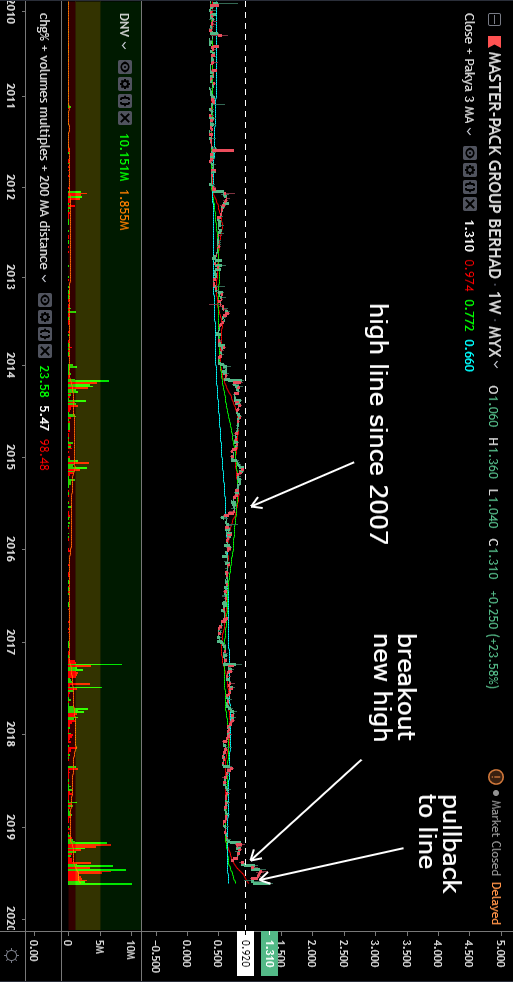
3) weekly chart strong. price above 20 MA. 20 MA above 50 MA. 50 MA above 200 MA
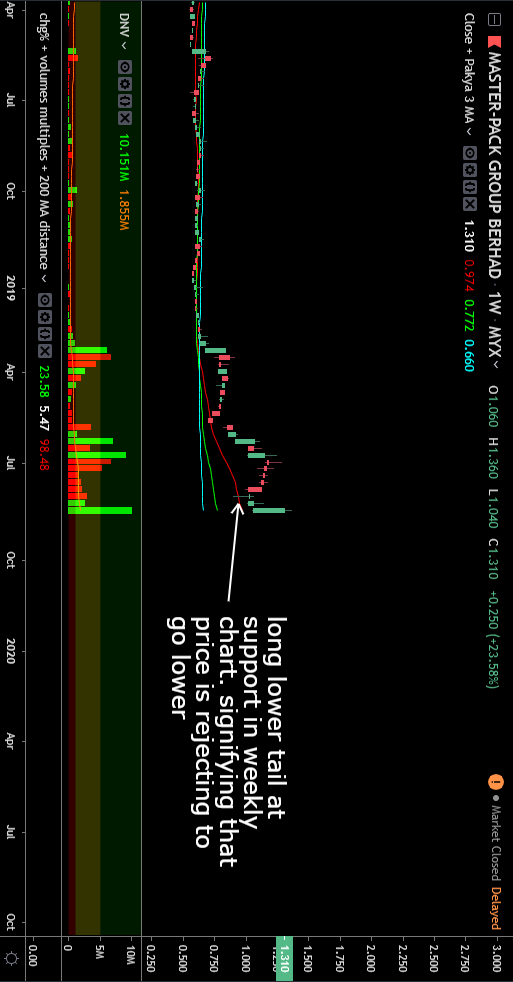
4) long lower tail at support dalam weekly chart, menunjukkan bahawa price is rejecting to go lower
5) breakout new high yang able to maintain above the line
-breakout new high is one of the strongest trading setup.
-cara nak tengok adalah :
• 1st, tukar kepada weekly chart
• 2nd, cari the highest high yang sesuai untuk past few years
• 3rd, plot horizontal line
• 4th, monitor closely kaunter2 yang pending breakout this line, kaunter2 yang berjaya breakout this line, and kaunter2 yang pullbacks to this line after breakout (macam MASTER)
• 5th, if that line able to hold during pullbacks, that means that counter is strong
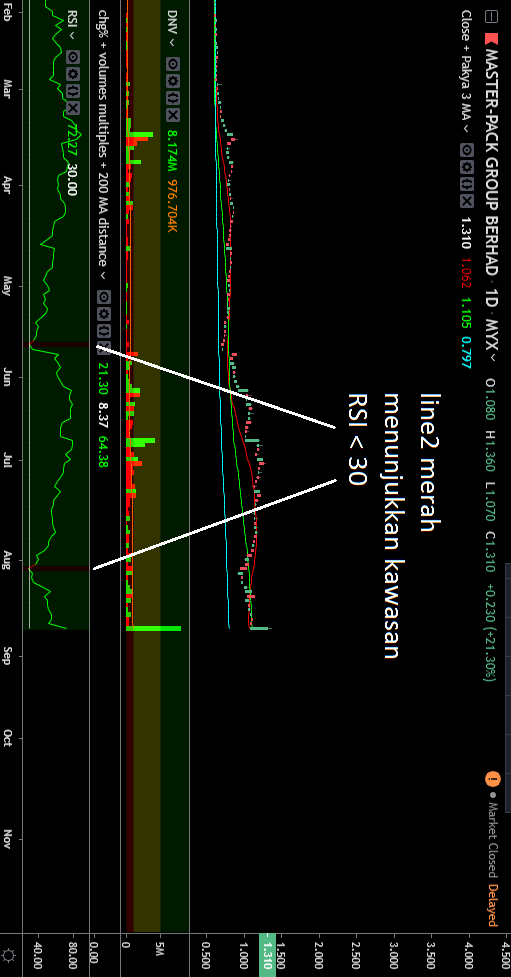
6) RSI < 30
-RSI < 30 menunjukkan kawasan oversold
-if this happens, it means too much selling happens and price expected to go higher soon
so that’s it. 6 important factors yang saya dapat tengok so far. each of this factor can be a trading setup even on its own. so pay close attention bila kita buat analisis kaunter2 dalam watchlist kita.
and continue practice as much as possible. someday counters like this will be very apparent to our eyes
that’s all. TQVM
Nice
Tq pakya
terbaikk.. baru dapat baca😊
Pakya, boleh banyakkan cth2 analysis mcm ni..
bagus artikel mcm ni, nampak jelas analisisnya.
Terbaik. Banyak kan analisis mcm ni pls. Thank u in advance.
insyallah
Ilmu malam ni tuan Pakya.
sangat membantu,terima kasih pakya…
welcome
Salam Pak Ya . utk Point number 6, bukanke klau too much selling price akan go lower?
too much selling > no more sellers > buyers dominate > price go up
Cantik betul setup mcm ni.. pakya kalau guna pakya screener tu boleh screen tak konter2 yg BO new high’
takleh. screen s2 and tgk satu2 mcm biasa
Isham ada bg screener All Time High..sy guna situ jerr.
boleh sy tahu macam mana cara nak dapatkan screener tu ya tuan? kalau boleh wasap sy terus 013 950 7285 terima kasih
https://www.isaham.my/screener/all-time-high
ni link dia…free jerr
Salam pakya. Apa maksud point ni “cari the highest high yang sesuai untuk past few years”.
Adakah maksudnya cari resistance yg sesuai dalam early stage 2 dalam past few years?
yep
Tak pa pakya.. Baru jumpa video breakout new high line bila sort by chronology.
Kalau bo new high kita monitor samada dia boleh maintain above the line.
Kalau bo 52w high kita terus set stop buy order. Macam ni ke Pakya?
sy tak guna 52w high so no komen. kena test sendiri
kalau setup mcm ni…kat mana best entry pakya?
agak2 kat mana
Sya nmpk entry yg sesuai mase pullback kat MA50 dlam weekly chart plus ade long lower tail
Silap kat MA20 weekly
yep tu pn salah satu setup
slm, pakya sblom dia buat 20% tu ade ma20 cross bawah ma50, bukan ke tu sell signal yg kuat? apa rasional utk trader x jual masa tu? ke sbb dia harga tgh naik waktu tu kita mmng kena monitor dlu walau ade sell signal? thanks